Community APP
S’more
When you are new in a city, it’s just like you have a blank map to explore. We want our users to start their journey with S’more in the same way, but with a little extra guidance.
Each post on S’more must be related to a specific place in the city. Therefore, I started with a design that links users’ posts to real locations on the map.
To ensure a better onboarding experience, they’ll see some empty pins on map. These are pre-prepared recommended activities for users to start with.
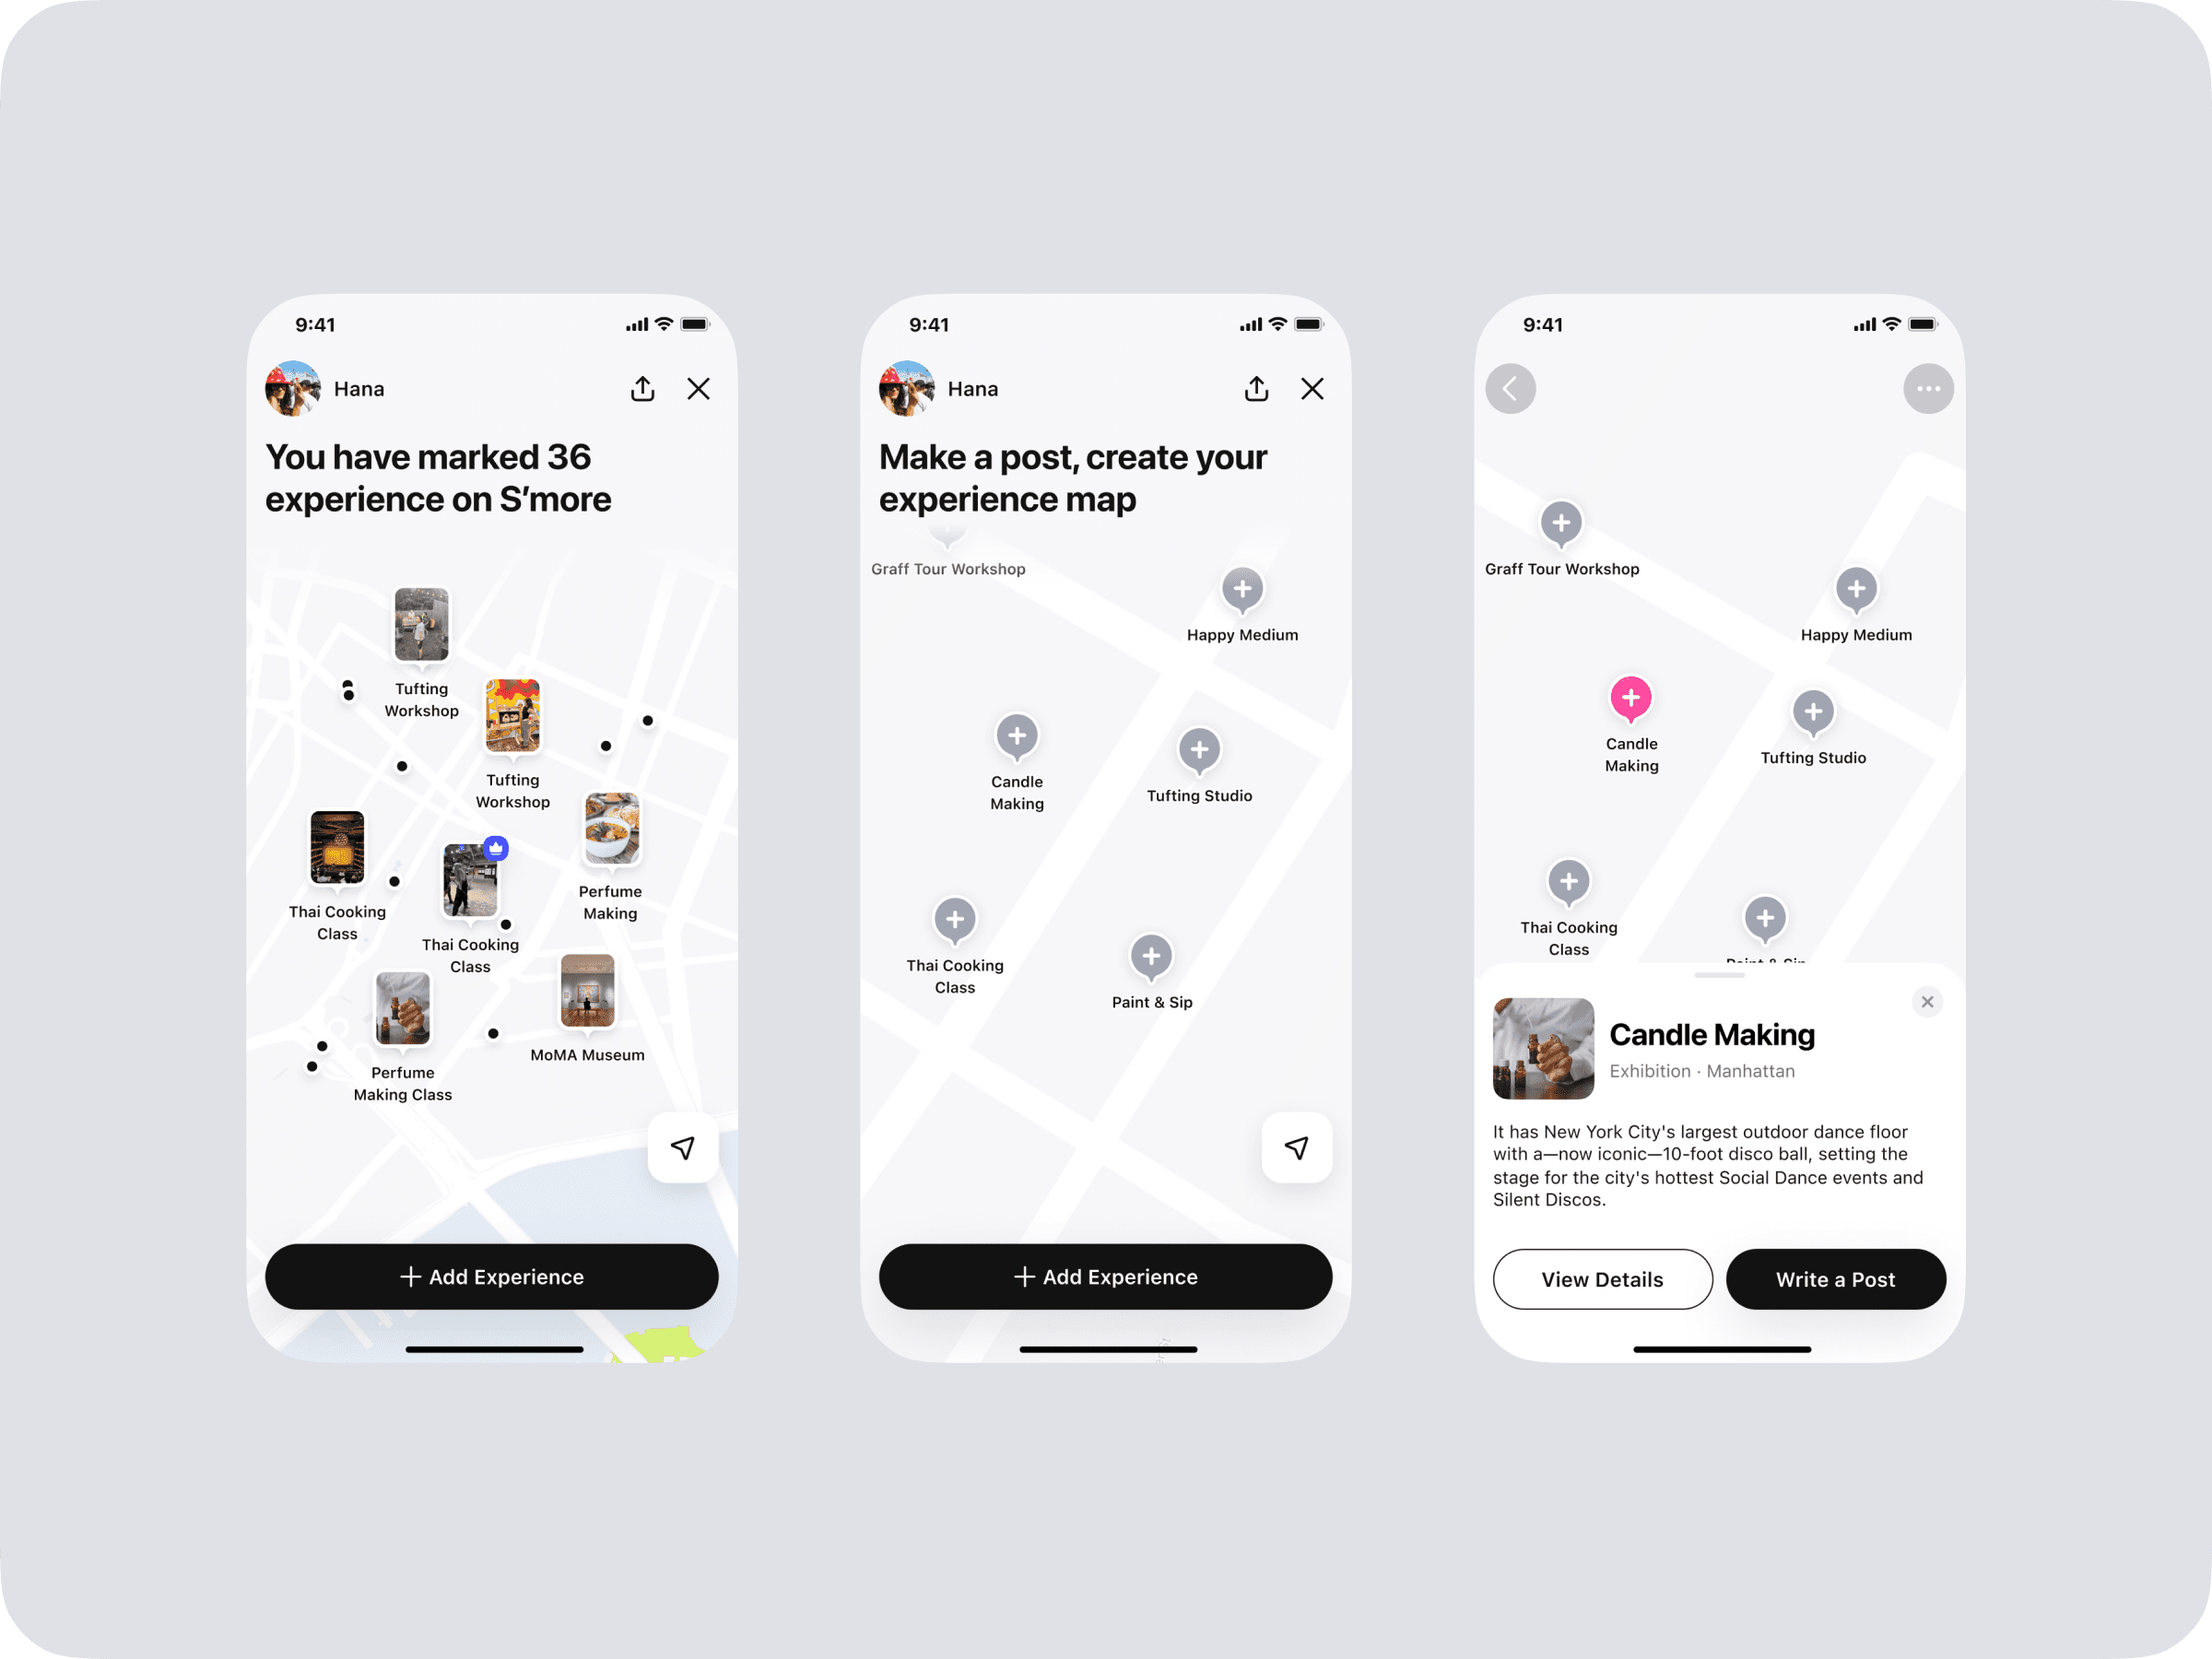
If you have nothing on the map, no worries, start with these recommendations
The map is just a tool, but can users also express their identity through it?
The map allows us to mark their footprints while exploring the city, but it doesn’t directly reveal their preferences. You can only see which areas they’ve frequently been.
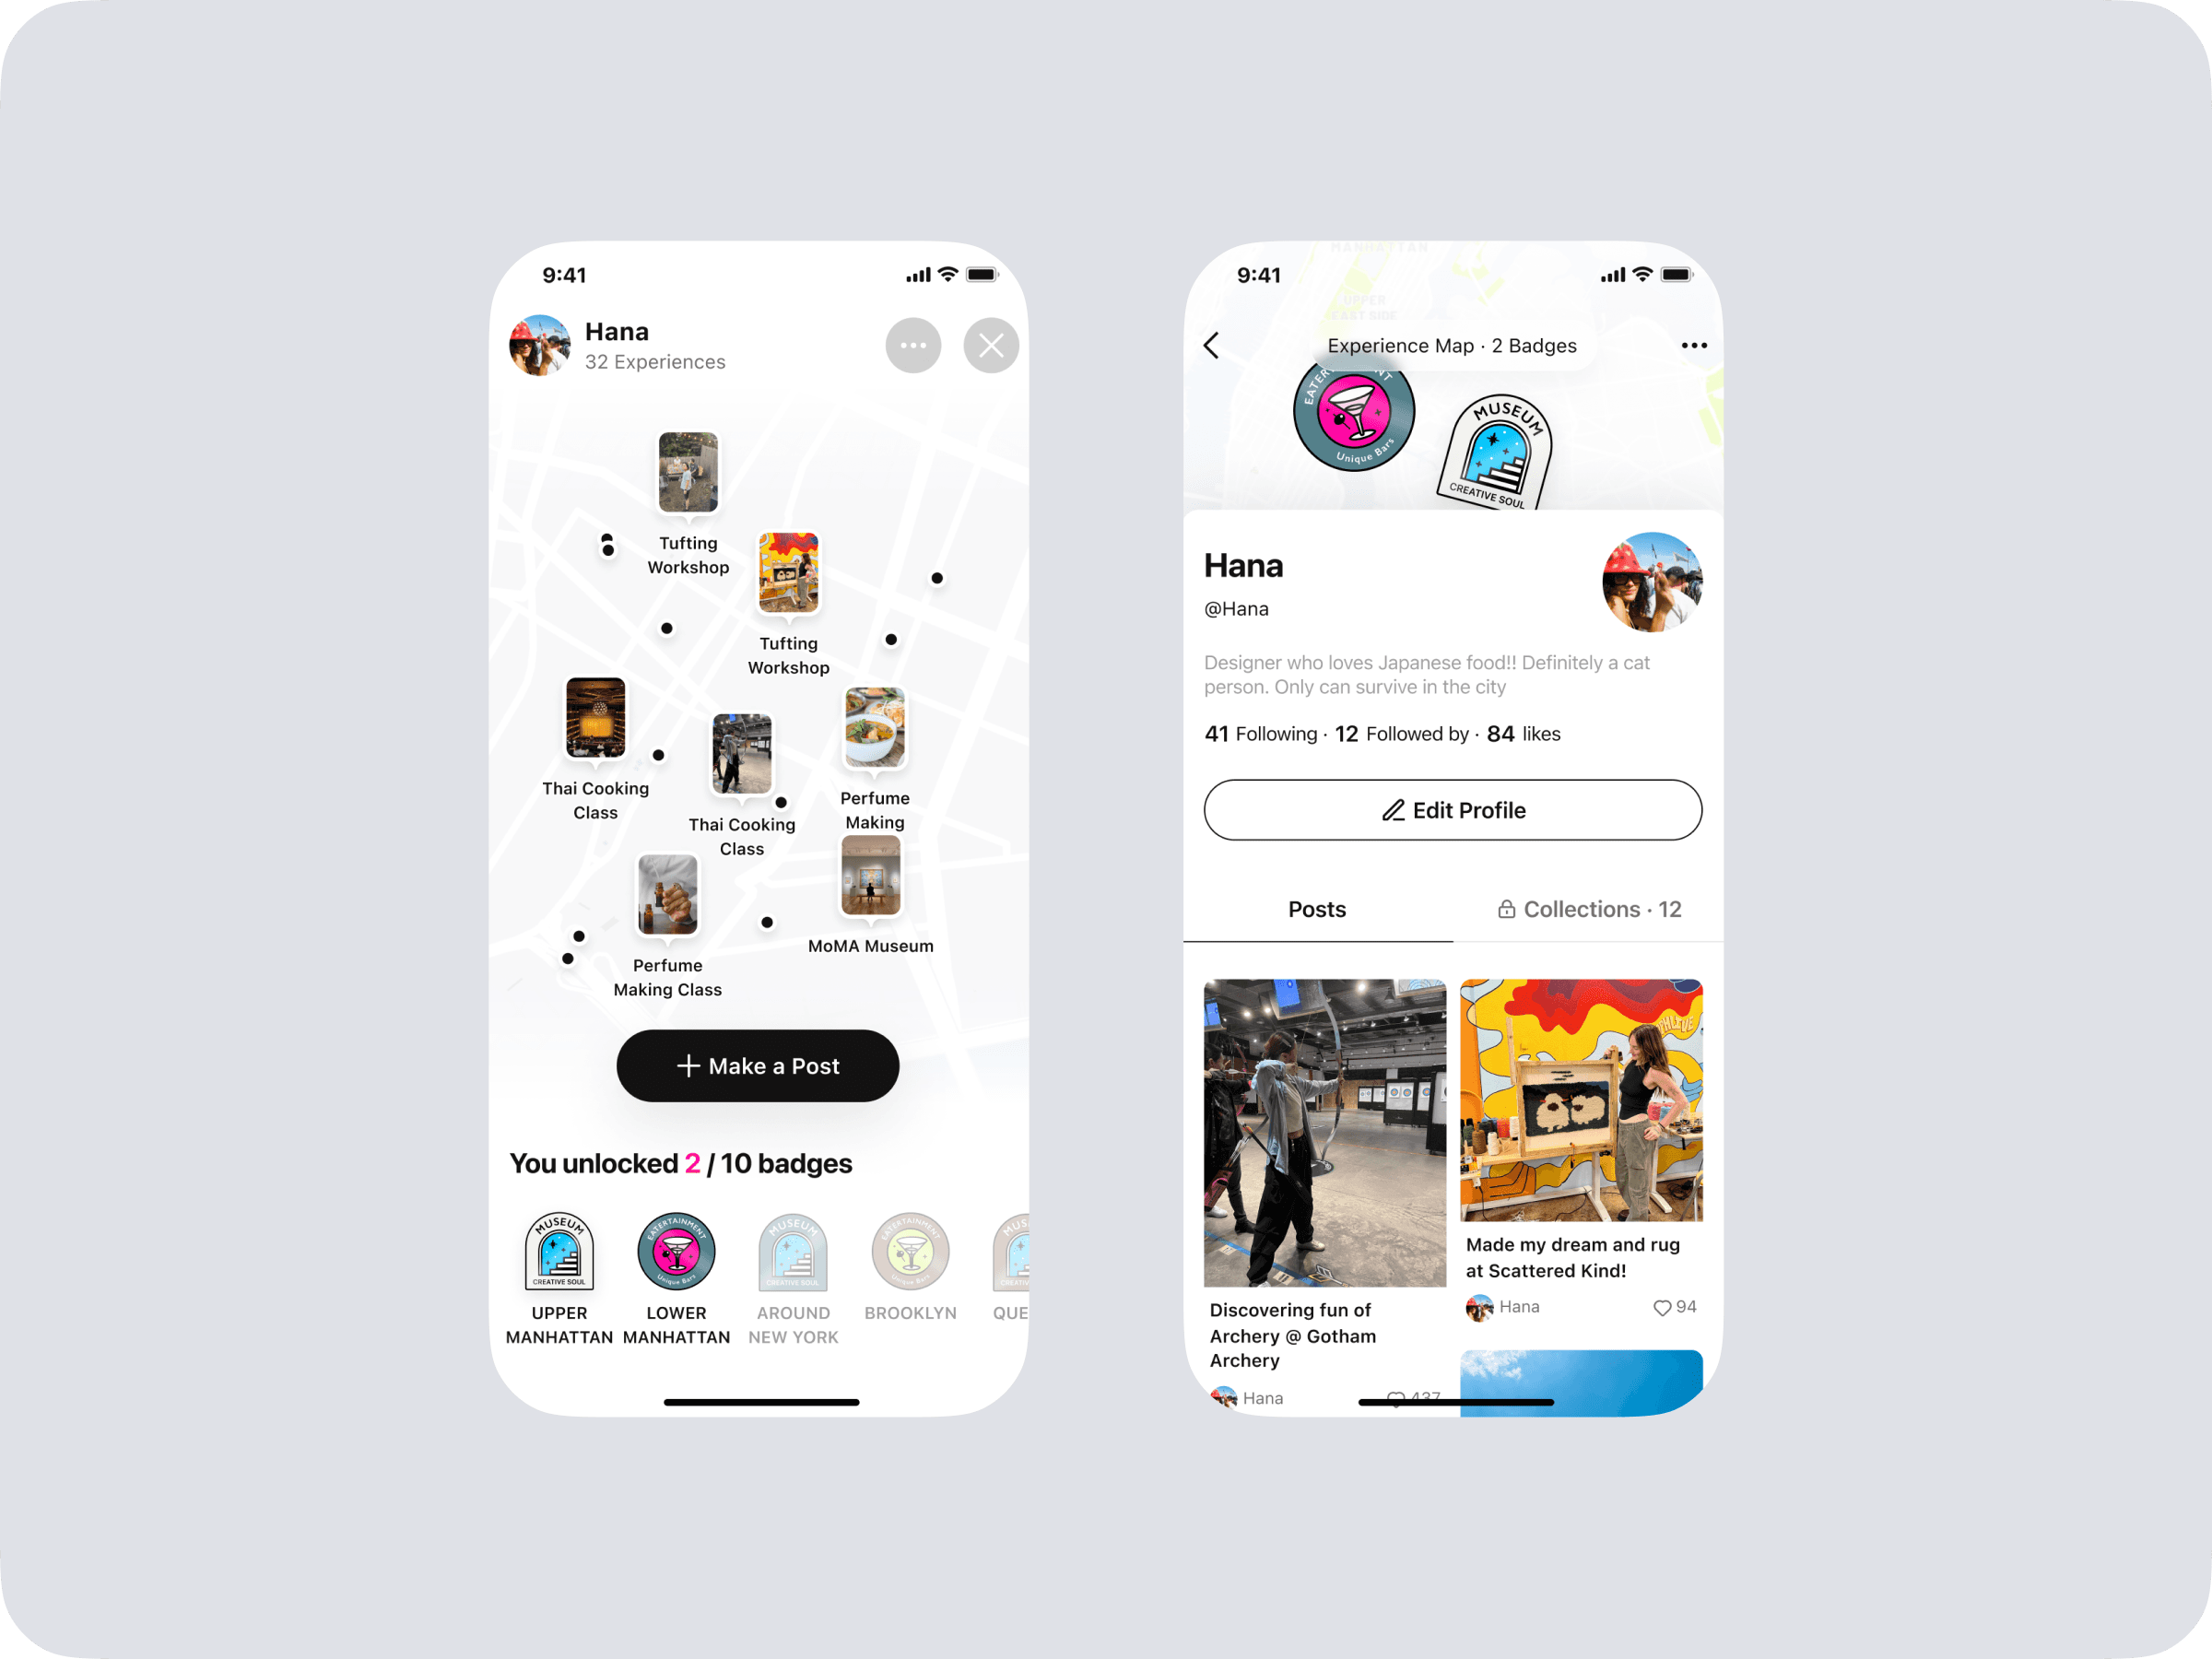
Design A: Introducing badges as awards
I explored a design where we award badges to users when they reach certain milestones in exploring things to do. Users can then use these badges to decorate their profiles and showcase their achievements.
Design A: Introducing badges as awards
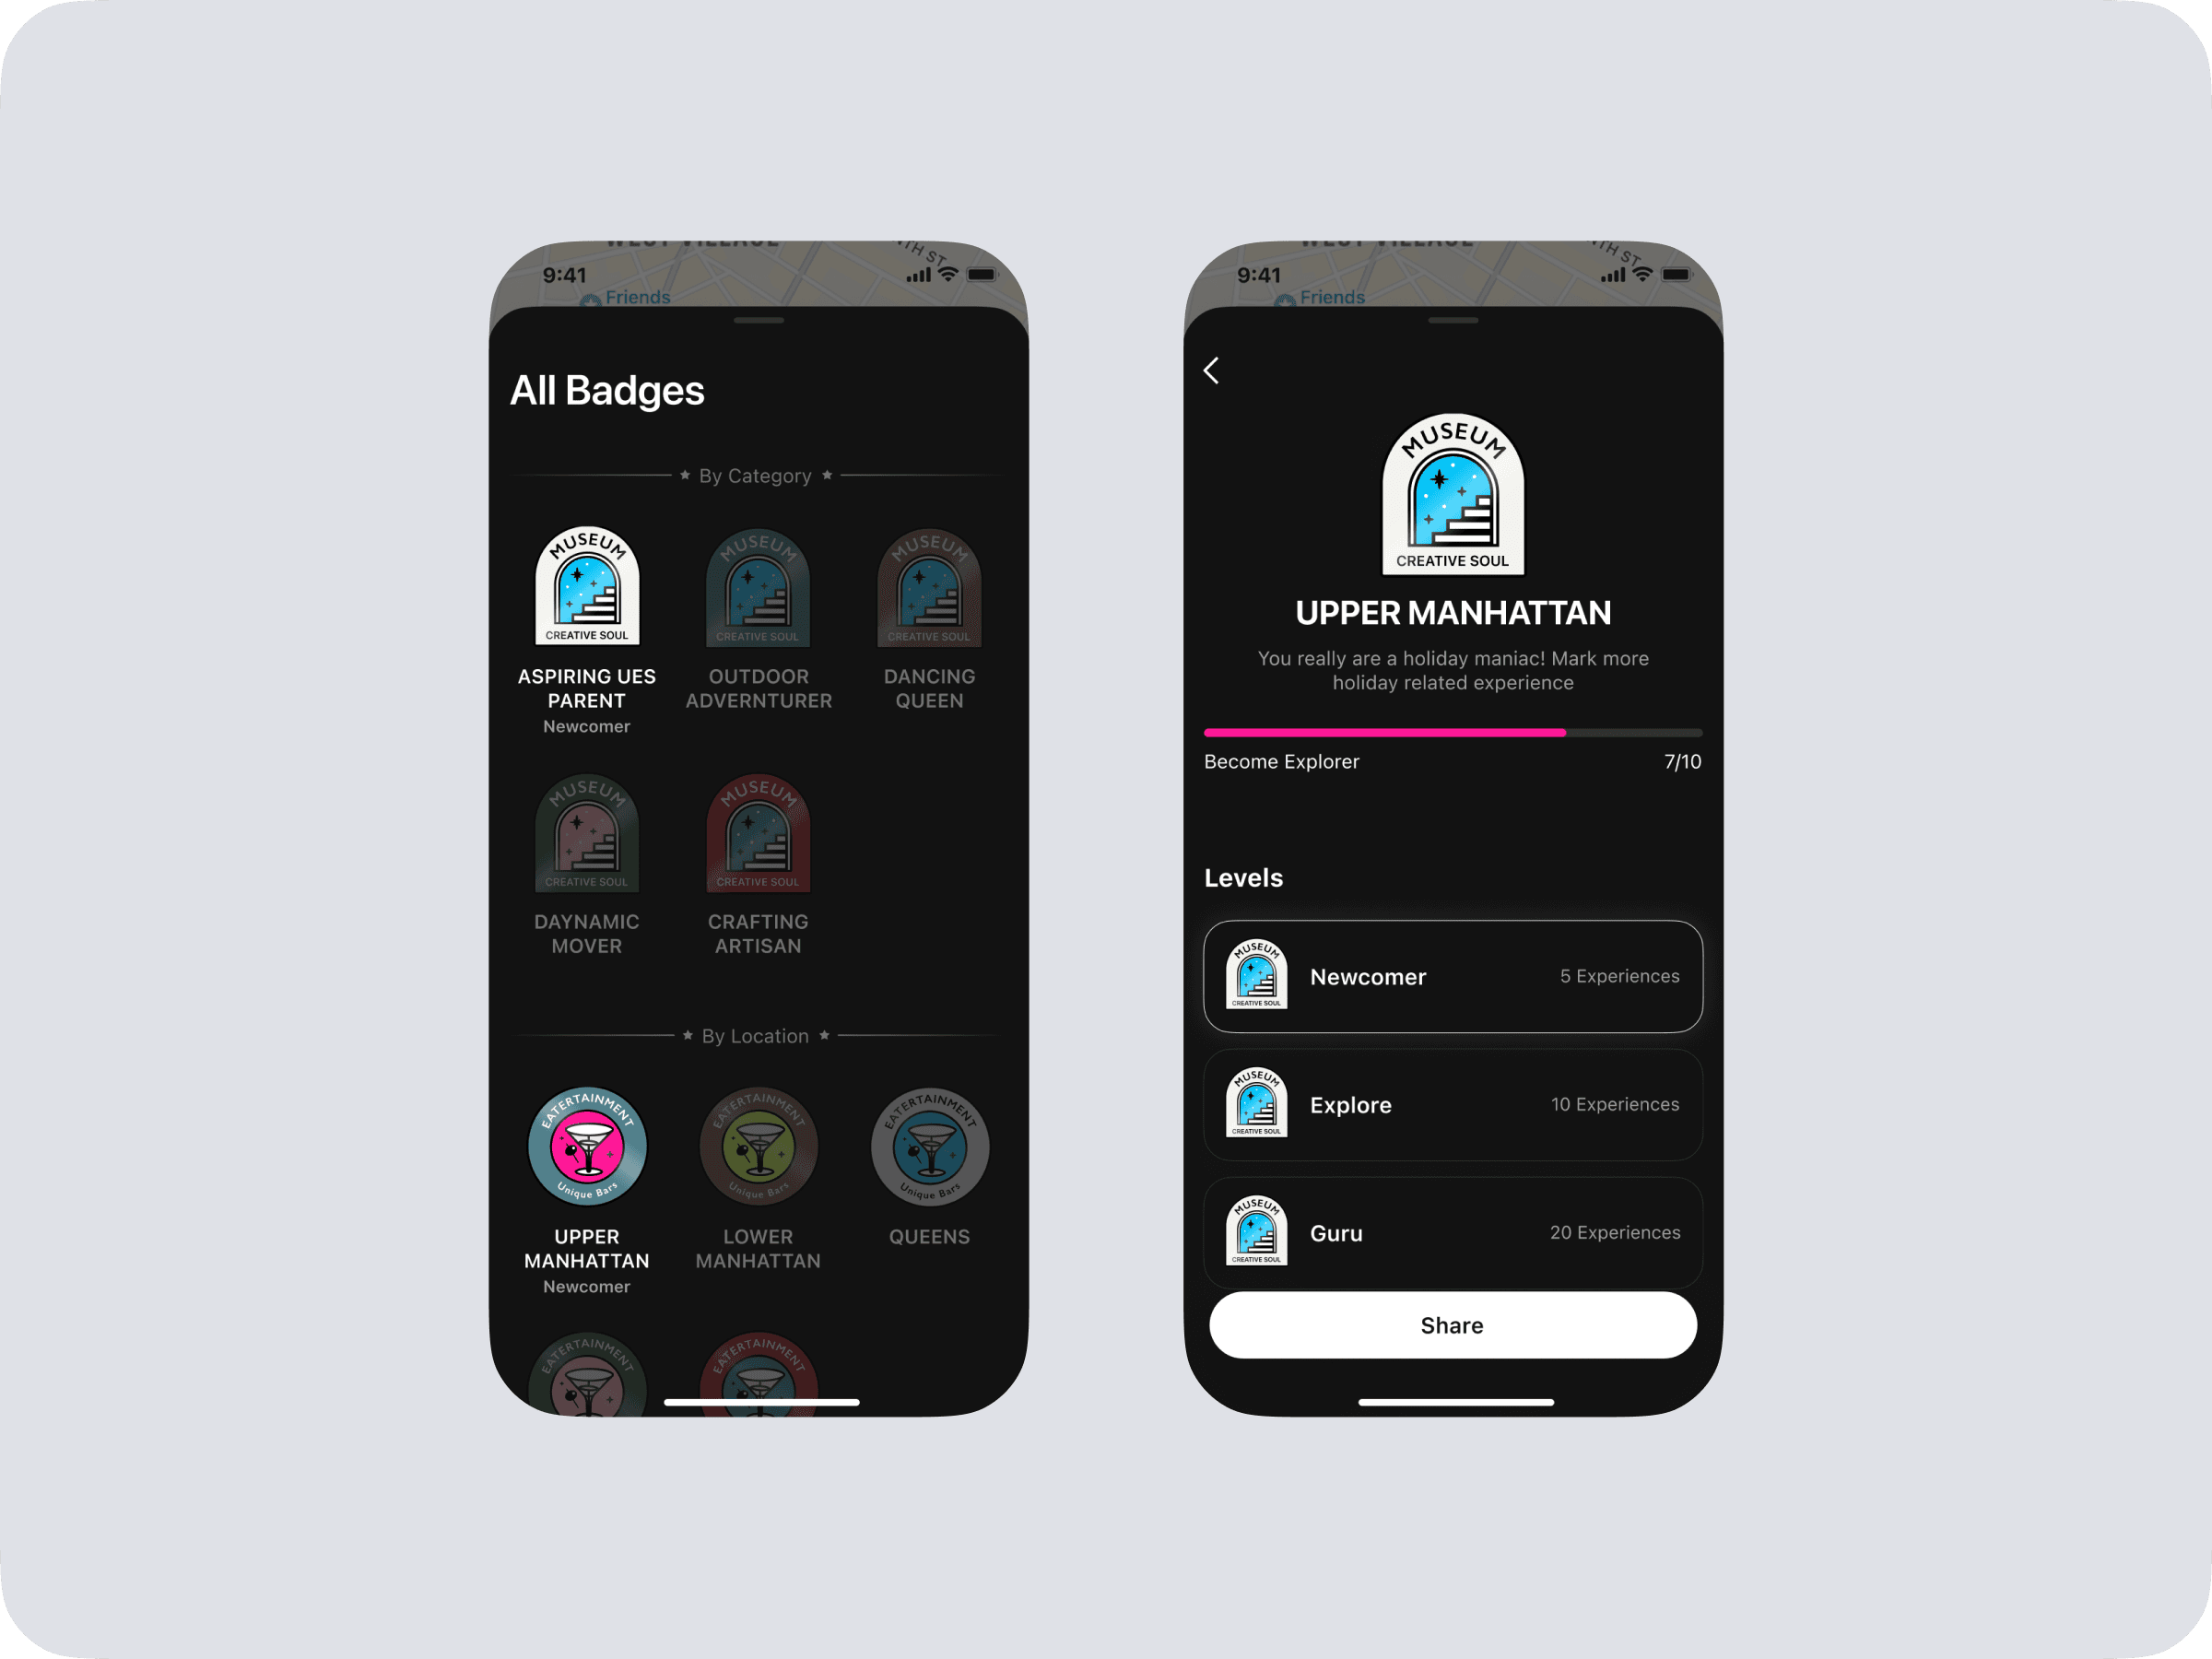
Each badge can be upgraded with more experiences posted
Design B: Experience Log
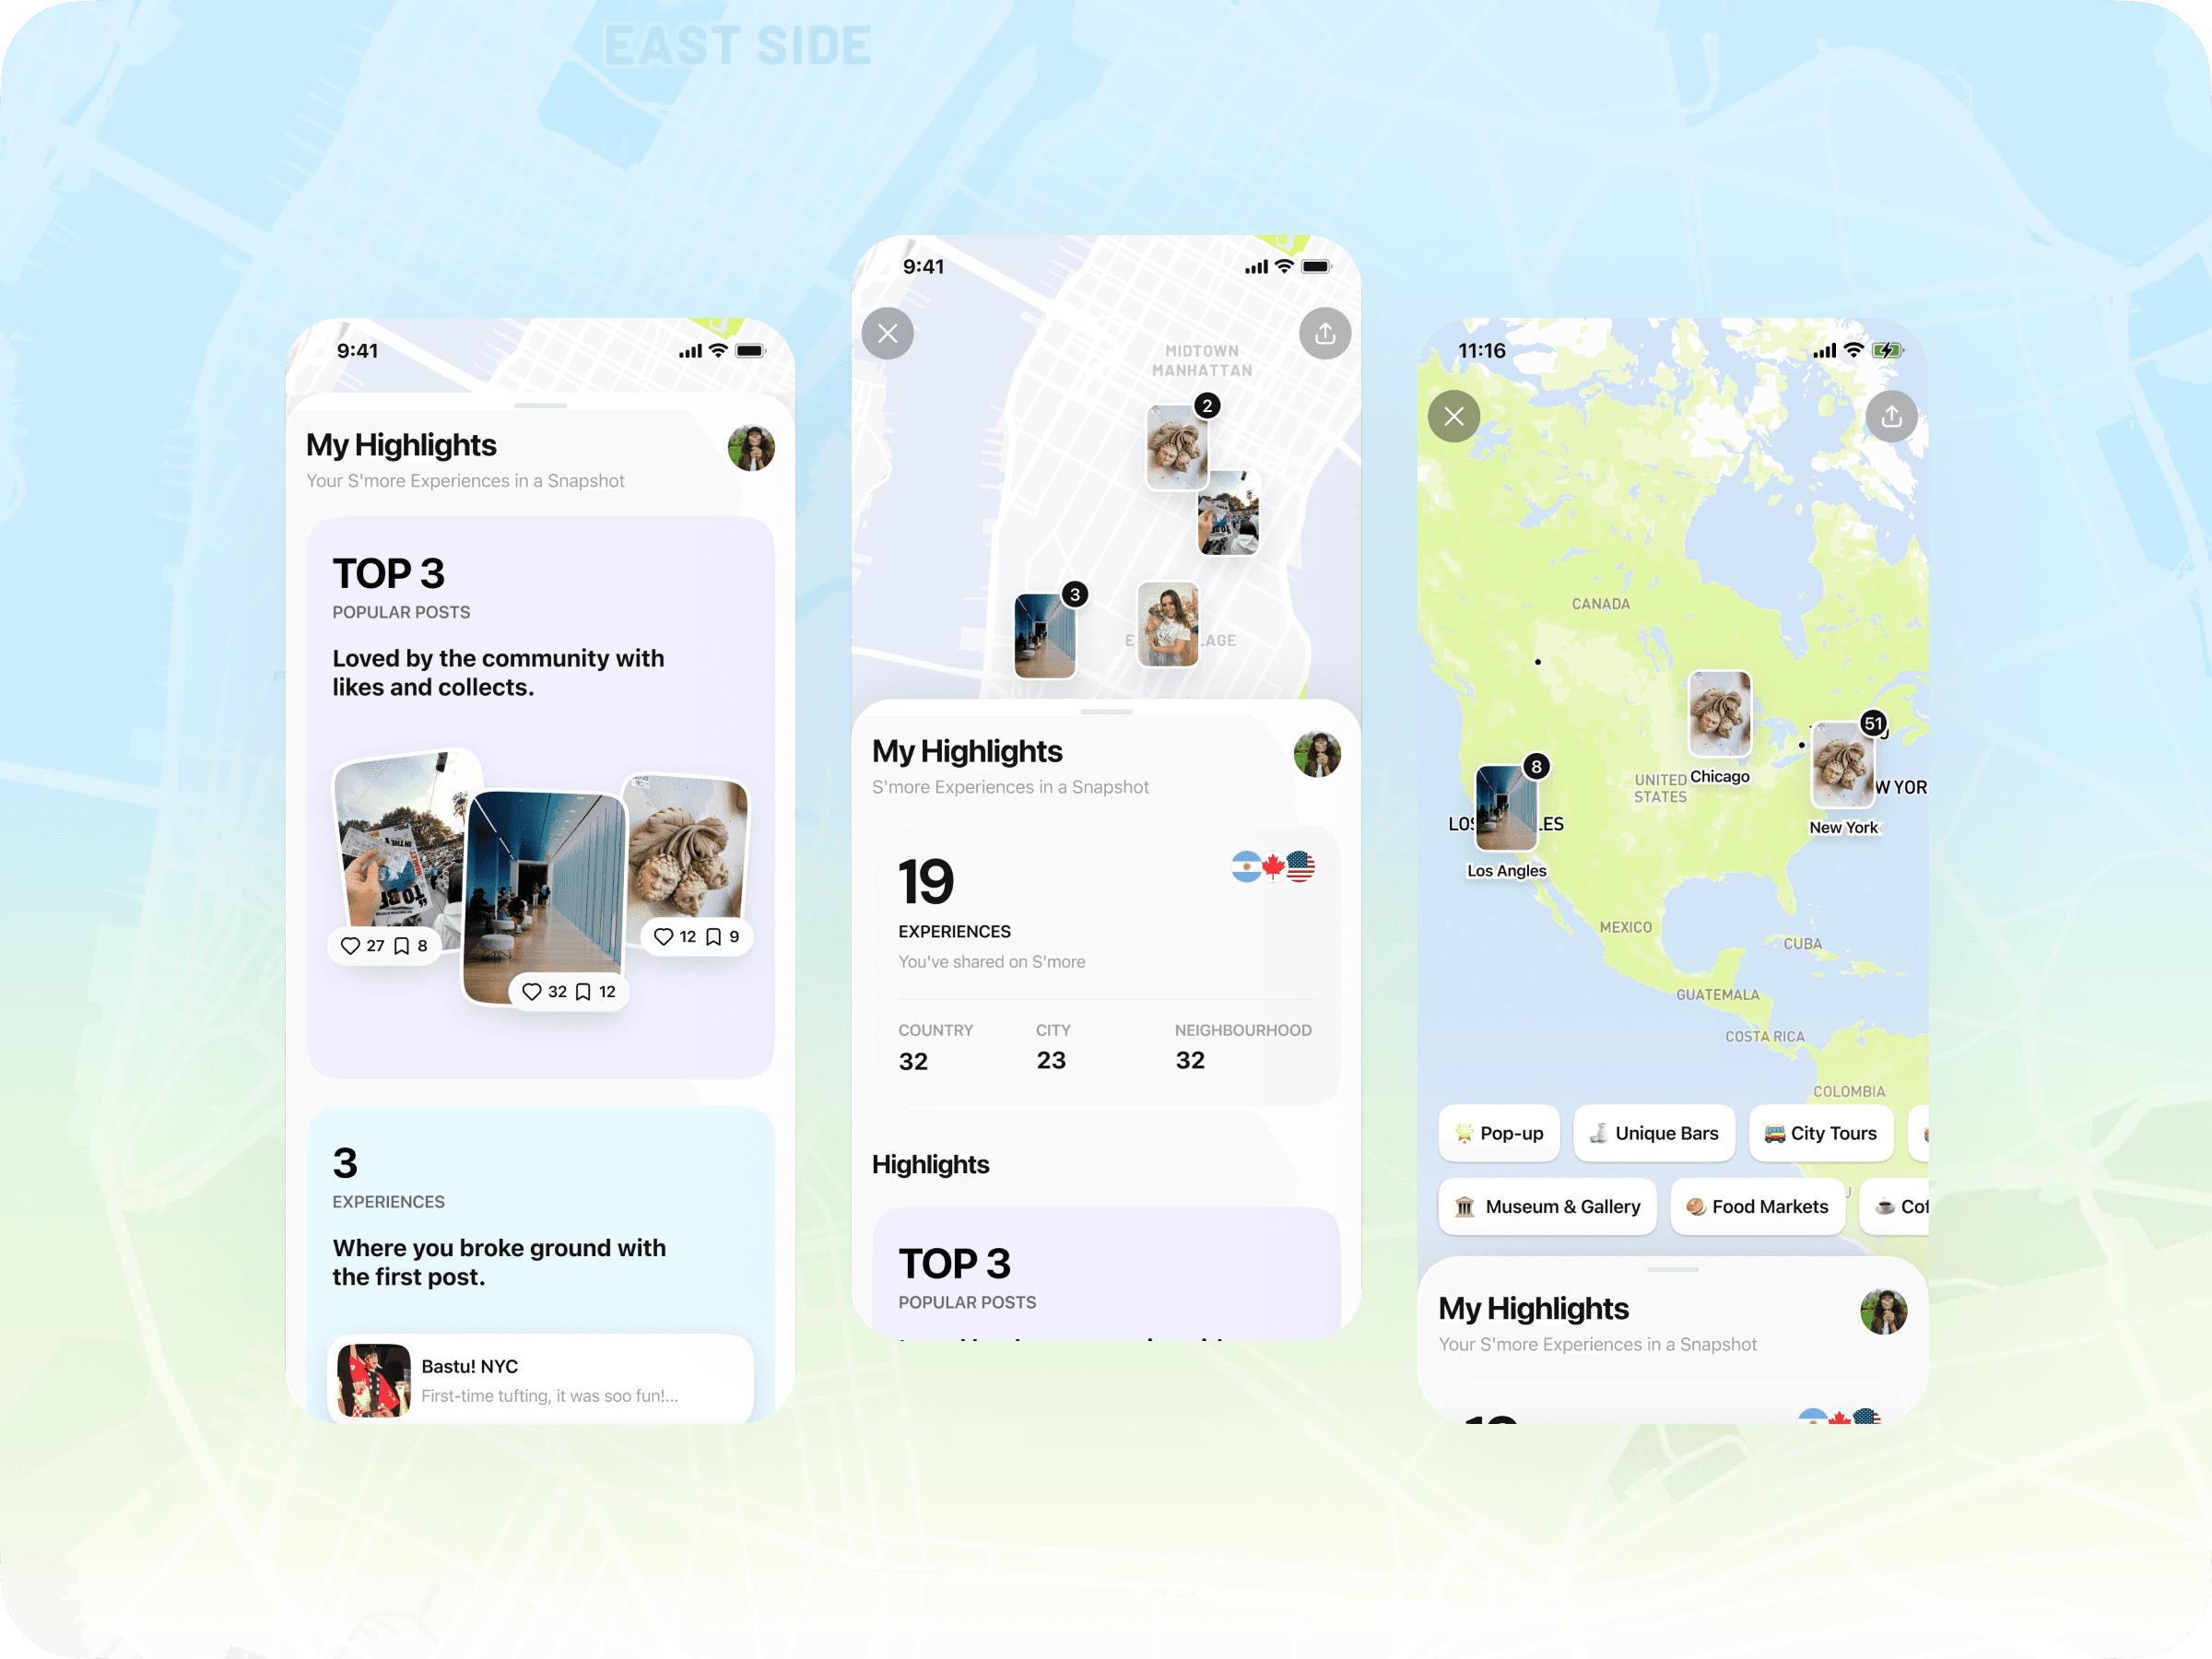
A badge is something users need to 'win' by reaching a specific milestone; they won’t get it if they don’t meet the requirement. Alternatively, we can generate keywords or highlights from their posts, so even if they don’t have many posts, they’ll still have something to showcase.
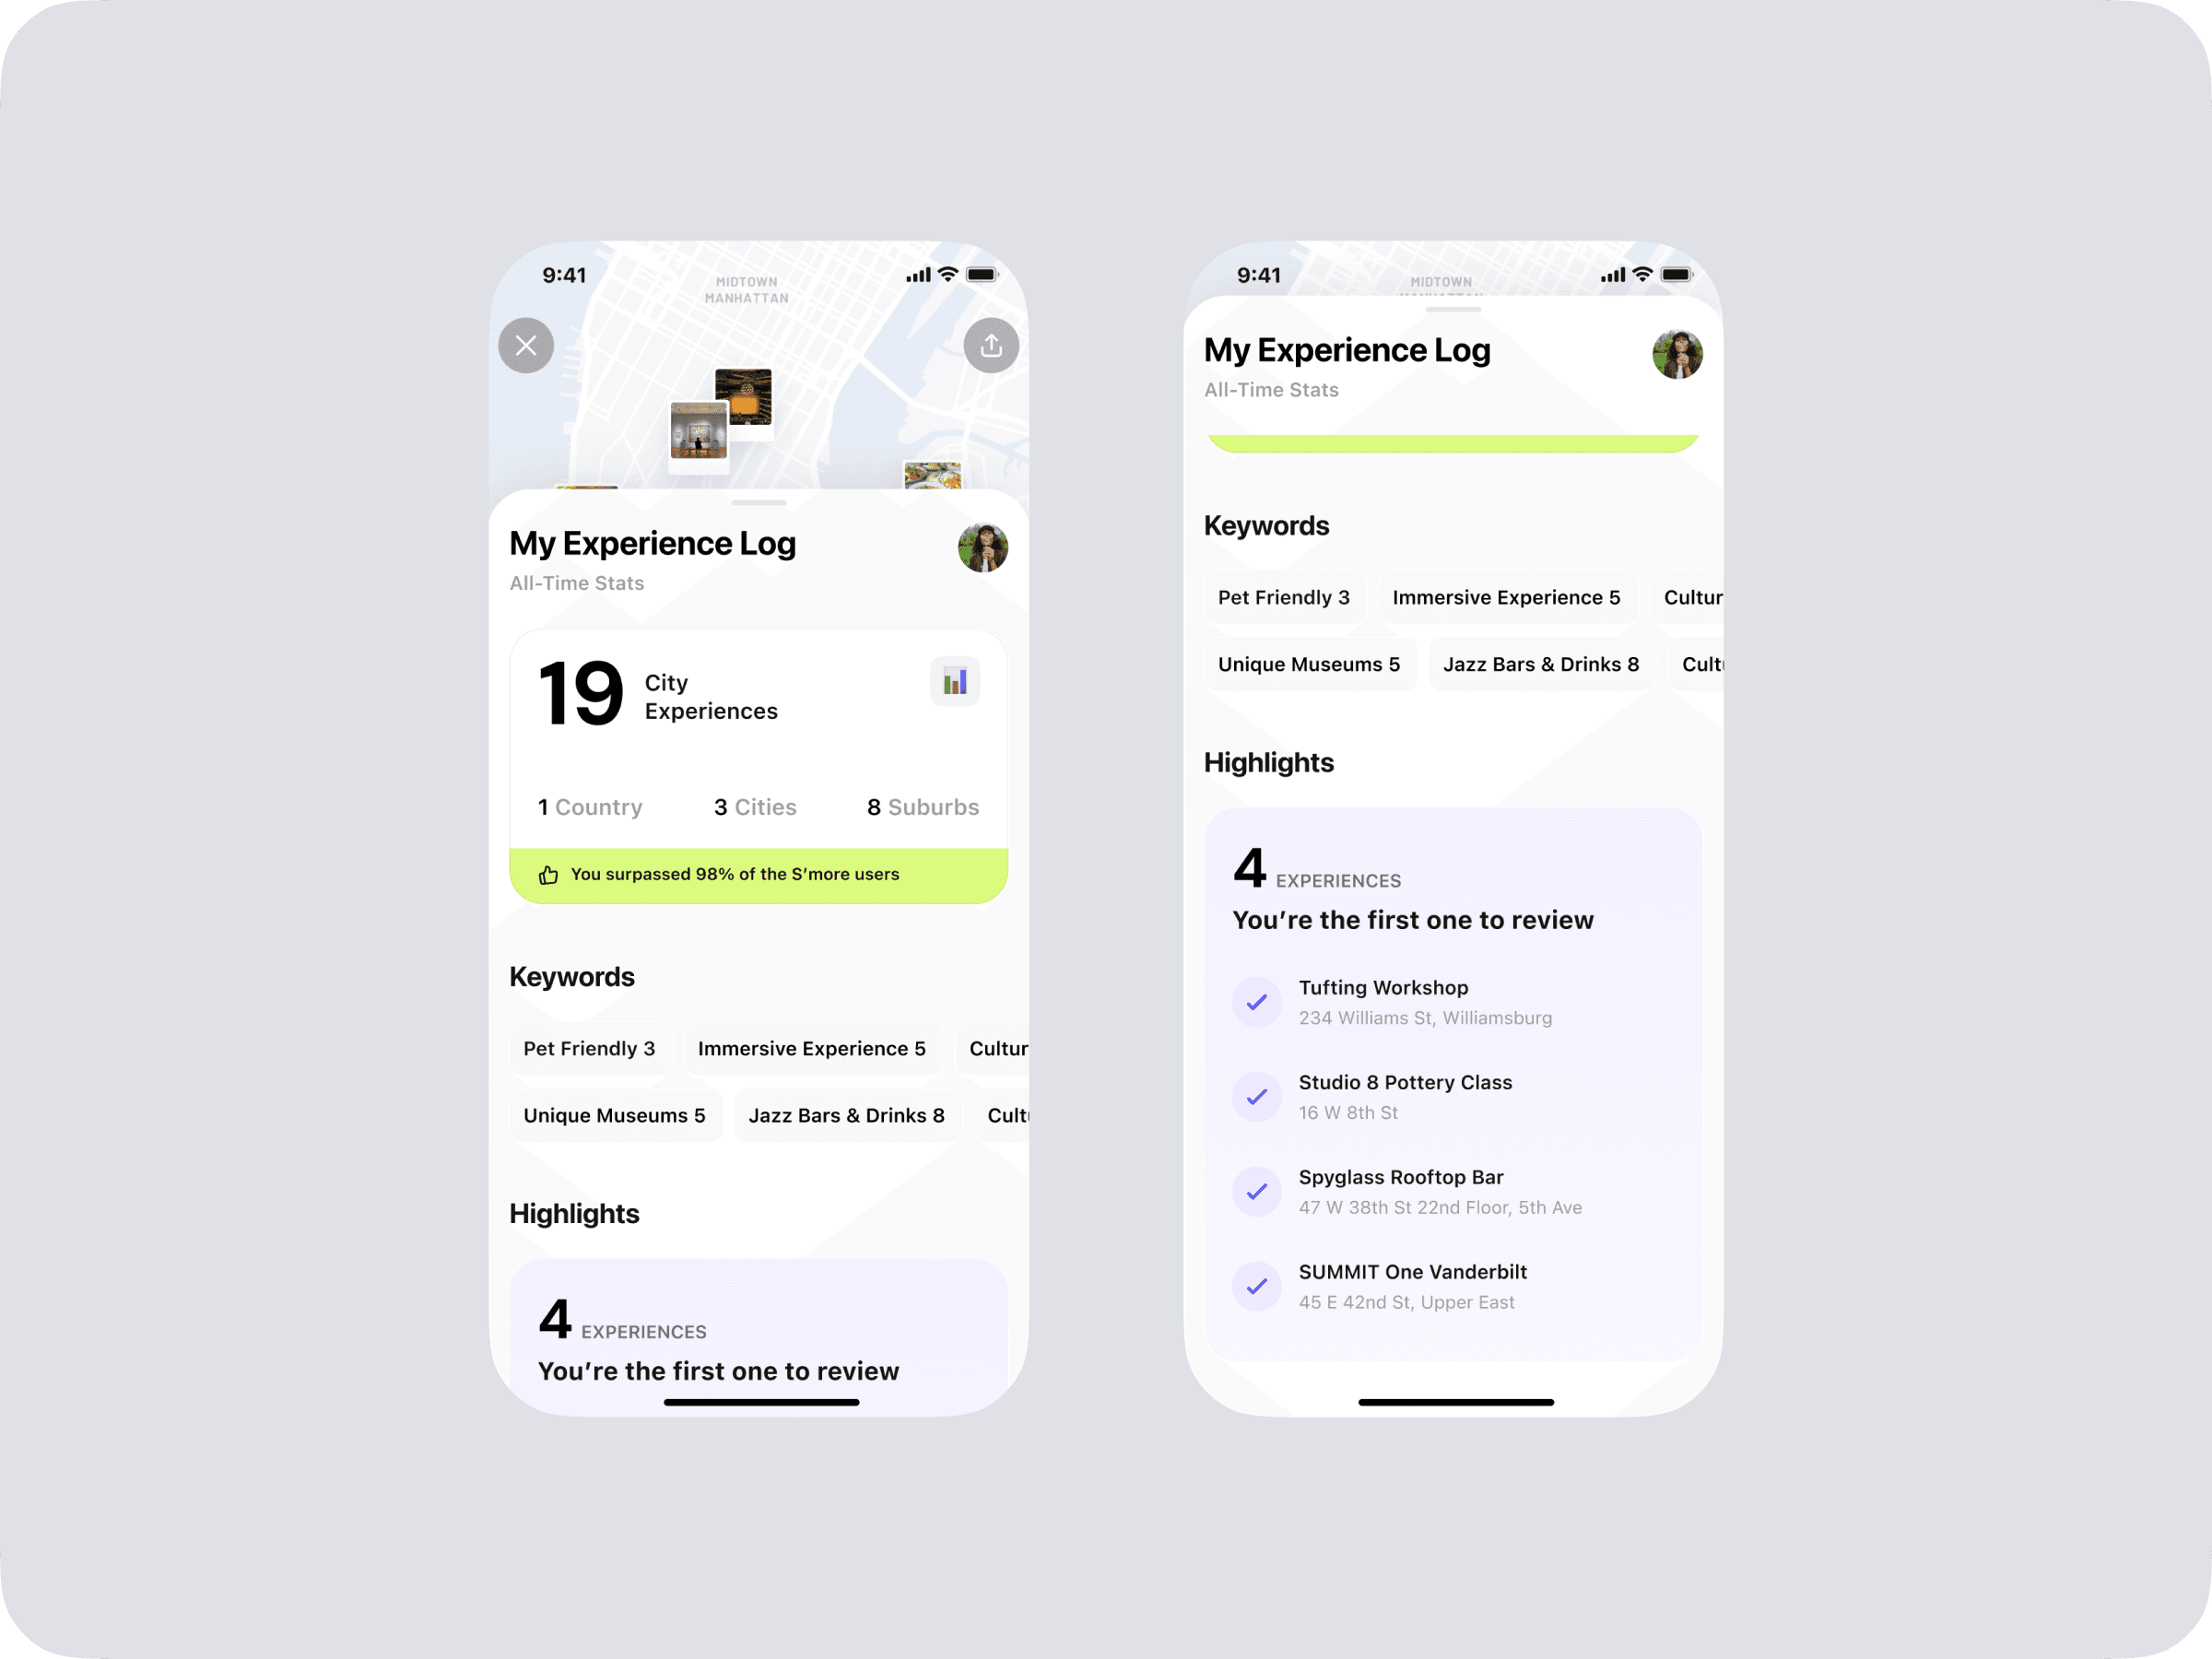
Design B: A dashboard that analyzed user’s behaviors based on the map
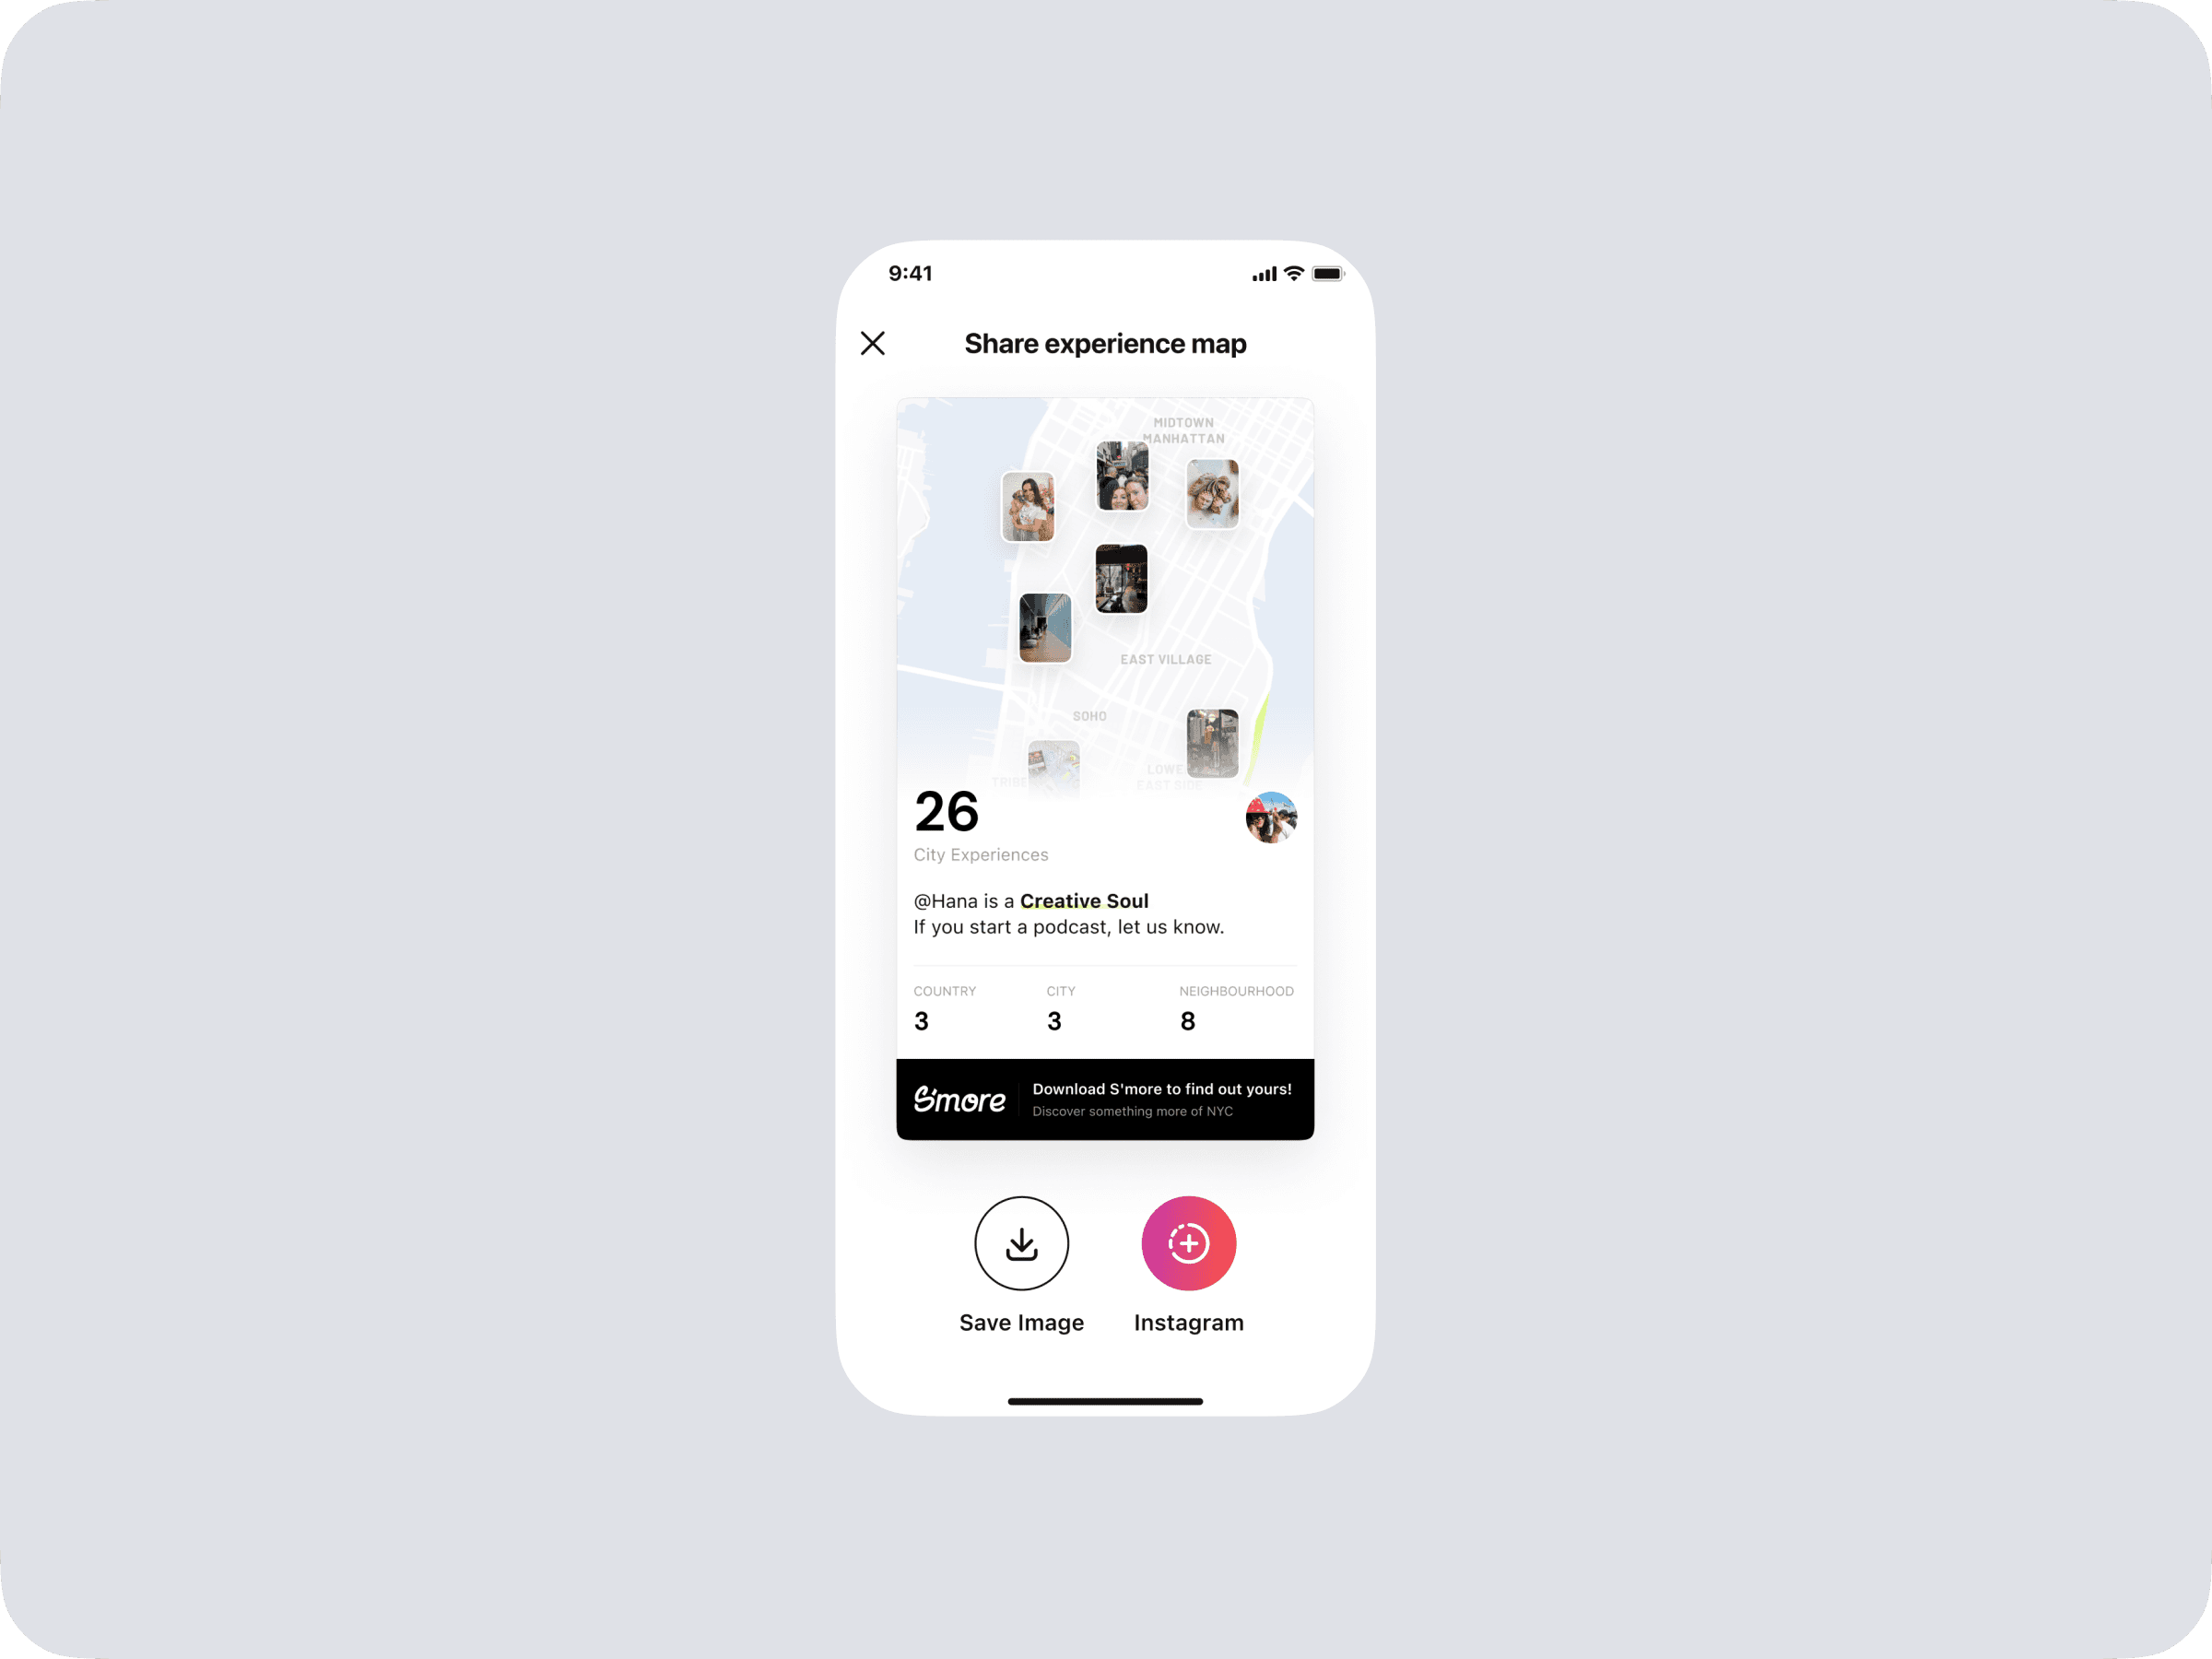
We decided to go with the experience log because it’s more flexible and fast for testing whether users are motivated to fill their maps with more posts. However, this design still needs to be curated.
I designed a mixed view with the map as the background and highlights displayed in a panel, focusing on pictures to make it more visually appealing instead of just text.

I designed a mixed view with the map as the background and highlights displayed in a panel, focusing on pictures to make it more visually appealing instead of just text.
Users can interact with the keywords on the map and tap on them to see the details of the posts.